

Backtesting: from hypothesis to evidence
How I made trading experiment analysis 18.3 times faster, reorganized a complex research interface, and preserved control over settings, results and optimization.
Independent product · Product design and implementation with LLM tools · 2026
Strategy research is a repeated cycle: define a rule, run a calculation, examine the trades, change parameters and test again. If analysis takes over a minute and settings are mixed with results, each experiment requires more waiting and effort to recover context.
I developed Backtesting as one tool for this cycle. The work covered analysis speed, the interaction model, protective rules and evaluating proposed improvements. On a control trade journal, analysis went from 79.18 to 4.33 seconds, with matching calculation results.
This measurement covers server-side analysis of a saved journal, rather than the entire backtest or a user’s task time.
Product problem and my role
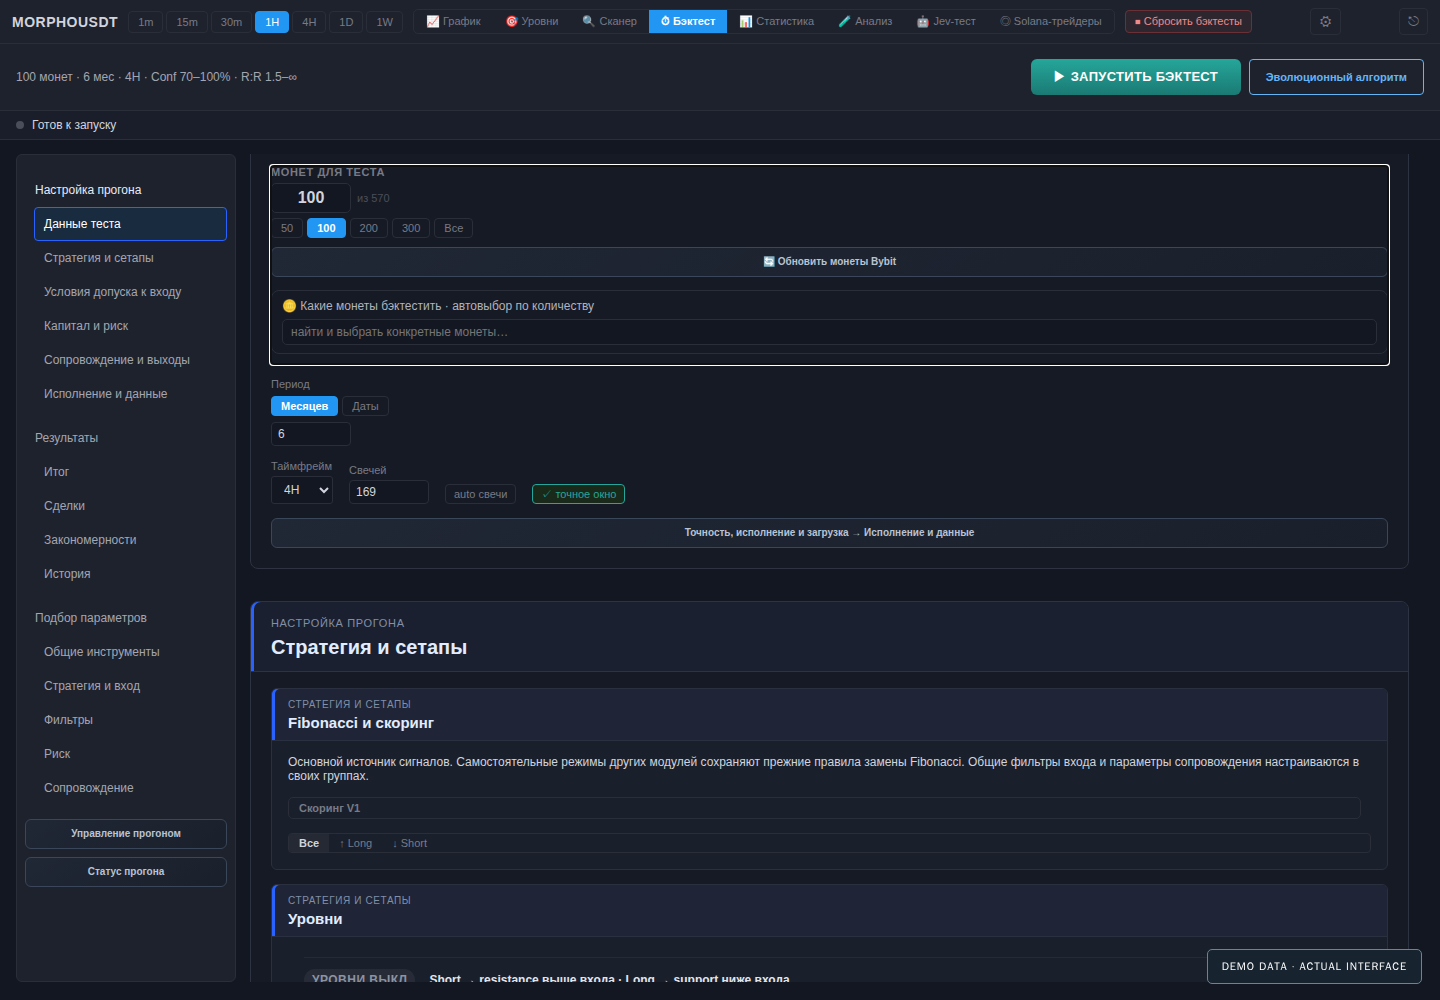
Backtesting grew from a tool for checking my own trading rules into an application with entry and exit settings, capital management, a trade journal, analytics, history and many parameter searches.
I owned the product model, interface structure and behavior, change priorities and implementation with LLM tools. My main research context was using the product myself and examining saved runs.
I identified three workflow constraints: waiting for analysis, mixing different experiment states, and insufficient evidence for applying a suggested change. These led to three priorities: shorten the feedback loop, keep settings connected to results, and compare each proposal with its baseline.
1. Reduce waiting while preserving the result
A July audit found that server-side metric searches filtered the full journal repeatedly for each combination. Thousands of variants repeated the same work.
The implemented version uses bit masks and a combined statistics pass. Heavy runs also received a shared queue: one worker performs the calculation, while other runs receive a queue position. The workflow needed both less waiting and a predictable execution state.
| Metric | Before | After |
|---|---|---|
| Analysis of the same journal | 79.18 s | 4.33 s |
| Trades in the journal | 41,839 | 41,839 |
| Matching variant results | Reference calculation | 3,264 of 3,264 |
| Full result checksum | Reference | Matches reference |
In this measurement, waiting for one analysis fell by 74.85 seconds, or 94.5%. These figures are calculated from the measured durations. All 12 Rust unit/differential tests also passed.
The key trade-off was where to optimize: reduce repeated data processing while preserving the calculation’s meaning. A faster calculation must not silently change the hypothesis being tested.
2. Organize the interface around the research cycle
The previous 25 navigation items mixed editing, diagnosis and applying changes. I organized them into three directions and 15 groups: 14 thematic groups and general optimization tools.
| Direction | User question | Content |
|---|---|---|
| Run settings | What am I testing? | Data, strategy, entry, capital and risk, management, execution |
| Results | What happened? | Summary, trades, patterns and history |
| Parameter optimization | What should I change and test next? | Candidates for entries, filters, risk and management |
This changed the structure without reducing the feature set. Each block received a primary location, and related actions led to the relevant editor.
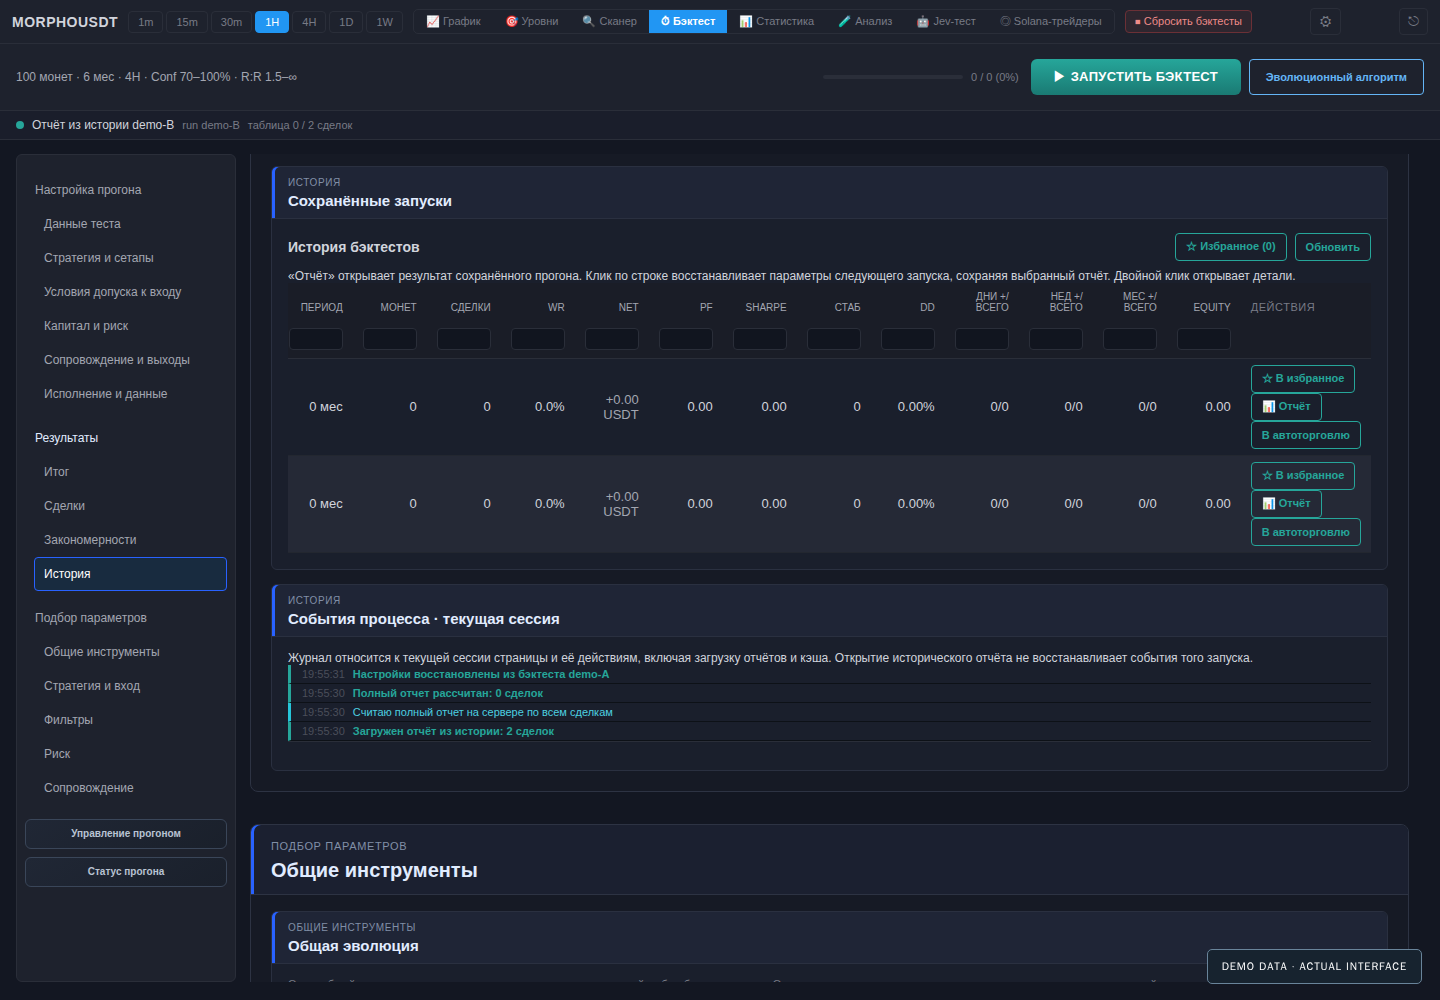
Three states needed separate treatment: the selected report, settings for the next run and an optimization candidate. With report B open, restoring A’s settings changes the form while preserving B as the selected result. Viewing a candidate does not apply parameters; ordinary navigation does not start a calculation.
3. Provide continuous browsing without unnecessary updates
After separate views, I moved to one scrolling workspace. Groups stay in the same flow, with menu links to each location. Users can inspect nearby settings without switching tabs.
The first version had a technical cost: changing the deposit triggered renders of 11 groups and 480 NumInput calls. After optimization, all five independent settings groups skip rendering while the capital group updates. In the control scrolling scenario, profiling recorded one menu render and zero page or form group renders.
These figures come from isolated Chromium with development React. They compare intermediate and optimized versions of the continuous layout. They were not used to calculate a change in production FPS or user task time.
4. Make protective rules clear and testable
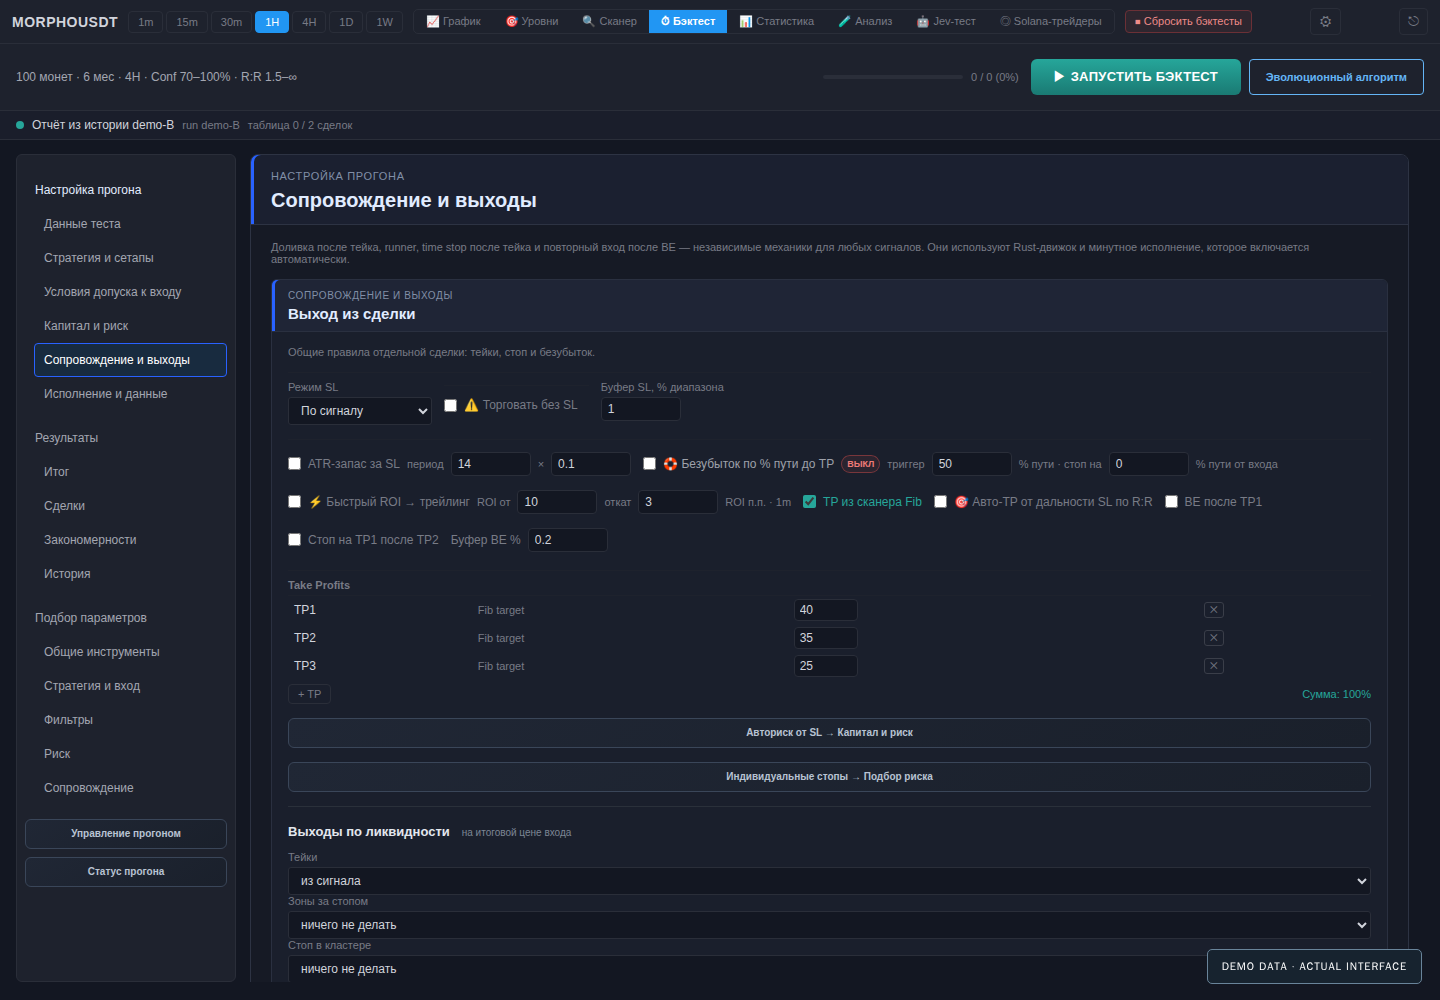
A July investigation found an ambiguity: stop adjustment parameters were saved, but the rule was disabled. Explicitly enabling it in a control rerun changed one trade from −40.04 to +1.43 USDT.
The interface gained an explicit on/off state, execution received a BE-PATH label, and parameters were saved in the trade snapshot. Separate long/short regression checks covered the behavior.
Making the interface state clear did not make every protective setting useful. Full reruns showed that an early exit could improve one trade while reducing the total strategy result.
| Variant | Trades | Positive trades | Net PnL | Max drawdown |
|---|---|---|---|---|
| Baseline | 28 | 57.1% | +294.28 USDT | 26.88% |
| Early BE-PATH 20/10 | 38 | 65.8% | −226.92 USDT | 43.39% |
| ATR stop + trend filter | 23 | 78.3% | +593.66 USDT | 21.05% |
The study covered DOGEUSDT from May 2 to July 31, 2026. For the third variant, net PnL changed by +101.7% relative to baseline, drawdown fell by 5.83 percentage points, and profit factor went from 1.62 to 2.85. This is an in-sample result with few trades. The report does not include independent testing of these parameters on a new period.
The product implication was to compare profit, risk and the changed set of trades together. A higher win rate alone does not determine the better variant.
5. Compare a complex model with a simple baseline
In September, the Jev model evaluated the maximum exit target. The dataset contained 1,394 trades across 188 coins. Evaluation used 1,387 closed trades, excluding seven open trades.
On 1,385 comparable trades, the model made 457 exact predictions versus 450 for a historical baseline: about 33.0% versus 32.5%, a difference of approximately 0.5 percentage points. The experiment required 1,387 requests, 2,733,038 input tokens and 68,680 output tokens.
I also checked how the model’s proposal changed the exit allocation:
| Metric | Original allocation | Jev allocation |
|---|---|---|
| Active entries | 1,387 | 717 |
| Net PnL | 7,547.20 USDT | 4,308.78 USDT |
| Profit factor | 1.416 | 1.403 |
| Maximum drawdown | 2,980.98 USDT | 1,390.62 USDT |
The allocation reduced historical drawdown but produced 42.9% less net PnL. This was a retrospective calculation of recorded executions. Changes in fees and slippage were not modeled again. The result did not establish that the allocation was an improvement.
Evaluating the feature became part of the product decision: consider the model’s cost and complexity, its added value over baseline, and its effect on strategy behavior.
Outcome: changing the whole workflow
The model for configuration, analysis and applying changes was implemented with compatibility for existing settings and history. Migration coverage included 178 addresses: 175 main blocks and three contextual dialogs.
| Check | Recorded result |
|---|---|
| Structural coverage | All 178 addresses have a destination |
| Navigation compatibility | All 25 previous addresses preserved |
| Run settings | All 750 checked fields matched on 393 artificial keys |
| Final hierarchy verification | 218 isolated browser scenarios passed |
| Continuous browsing | Suite expanded to 225 scenarios; after fixes, 35 affected scenarios passed again, with the other 190 passing in the full run |
Interface checks used artificial APIs, SSE and configurations. They verify defined behavior and compatibility. User task speed and reductions in user errors have not been measured separately.
My contribution connected product priorities, the state model, interface and implementation. Faster analysis was checked together with result preservation; the new structure with action preservation; proposed trading variants with risk and the consequences of a wrong choice.
The next Backtesting cycle
The next step is to check understanding with five participants completing three tasks, producing 15 observed attempts: identify the settings behind a report, restore another configuration, and apply a candidate and find the next validation run. This is a research plan, rather than a completed study.
Further development within Backtesting is to set criteria before parameter selection, separate the research period from independent testing, and preserve the decision for each version. Monitoring conditions during execution remains a separate future stage.
Where the numbers come from
Server analysis and 3,264 variants: the July 18, 2026 performance audit. DOGE variants and the protective rule: the July 31 report. Jev: the September 24 report. Structure, compatibility and render profiling: the October 15 implementation reports. Time reduction, net PnL change and drawdown differences are calculated from the stated source values. Financial figures describe historical research; they are not measured redesign impact or live account results.